Are the Landscaping Subsidies Worth It?
How I helped figure out how much water landscaping subsidy participants saved in Utah
In the land of Utah, the wild west is still alive through constant battles over water rights and policies. Most are adamant about fighting to conserve water for the Great Salt Lake and the growing population, but we struggle to find the balance between conservation and the many other uses for water, including farming, evaporation ponds, tech server cooling, the many beautiful lawns, and more, all useful, some necessary (like certain types of farming). So, we are getting creative about water use, and many efforts are underway to strategize efficient water use.
One of these efforts to conserve water combines the efforts of multiple cities who offer to subsidize landscaping to replace lawn (with its thirsty need for water) with more water-efficient landscapes.
This policy has been in place for a few years and continues on. However, good policy implementation requires a way to measure how well it’s working. In this case, the cities of Orem and Sandy wanted to know if water was being saved, and how much. So two BYU scientists were tasked to uncover if and how the policy is helping save water.
The Research
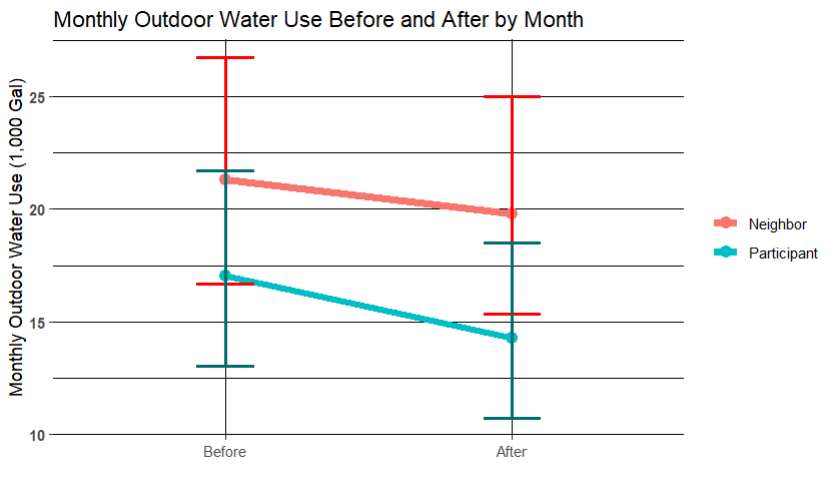
With data from Orem and Sandy, these two began to think about different methods that could be used to uncover any potential effects. They began by taking into account how much water was being used indoors by the study subjects, and subtracted that estimate from the total, leaving an estimate for outdoor water use. They then chose pairs of houses to create a control group and a participant group. The participants were those who landscaped at least part of their lawn and participated in the subsidy program. The control houses were those that had a similar landscape before the parhttps://www.linkedin.com/in/thomas-witney/[ticipants changed theirs. This created the setup for a ‘difference in differences’ study, a type of analysis that is often used in causal inference, the gold standard of quantitative policy analysis. Having a control group is necessary because many outside factors could influence outdoor water use for participants: droughts, heat waves, precipitation, etc., that may hide any effects that the landscaping might have had on water usage. However, the control group creates a sort of baseline that shares factors with the participants’ houses, as they share the same weather, similar sizes, similar geography, and omre. Given this, what we look for in this analysis is how houses decreased water use compared to the control groups. Figure 2 of the results might help that make more sense.
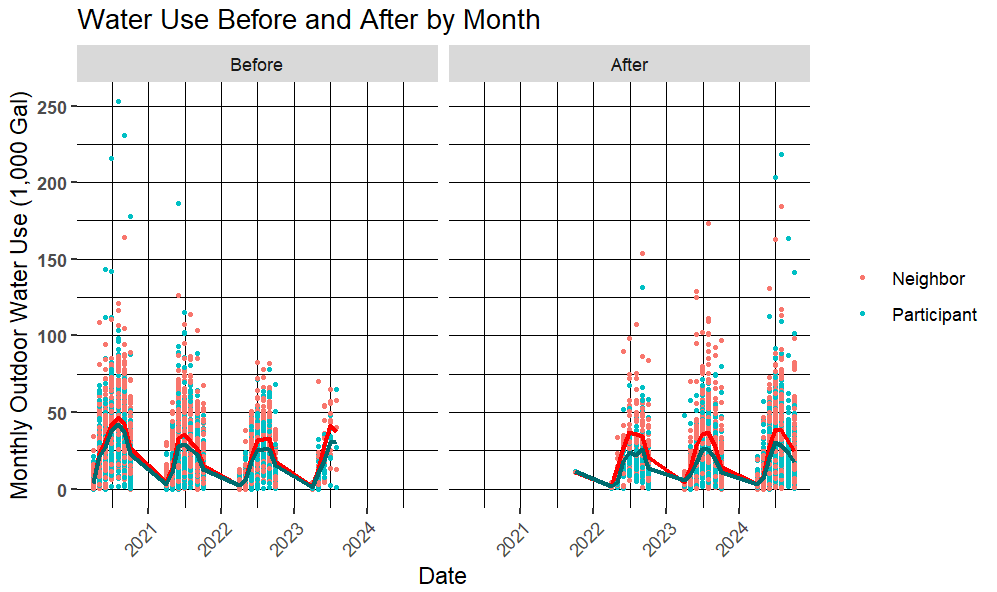
However, there is one key element missing from this study that would make it truly causal: random assignment. This is observational data, for the most part. Those who landscaped with the subsidy program were volunteers. This means the results aren’t exactly representative of the average Utahn, and estimates on how much water any given Utah property would save isn’t possible. Why? Because we don’t know if those who volunteered are part of a special group of people who don’t represent the average Utahn. They may already be more water-conscious citizens, or dislike taking care of lawns more than the average Joe or Joanna, already resulting in using less water compared to their neighbors before they even landscape. It could have also meant they were the kinds of people using too much water, and were particularly guilted toward landscaping. However, we believed the former hypothesis was more likely, given how participants used less water than the controls on average before they landscaped, seen by the blue line in the berofe panel of Figure 1.

The main drawback of participants not being random is that policymakers couldn’t go out and say, “If every Utahn landscaped their lawn to be more water efficient, we’d expect to save X amount of water. So if we wanted to save an additional X gallons of water, we need Y households to re-landscape,” which would be a nice thing to be able to say, as we could have evidence of a policy that could help our community save a desired amount of water.
Despite this, we are still able to draw some helpful, even causal statements that support the program. I was tasked to make visuals for and model this da[m0[ta that would allow us to find useful insights. Using a mixed-model or hierarchical regression with random effects on groups of houses that contained participants and controls, as well as a random effect on the cities, I found that on average, the participants used an additional 1,215 gallons a month **less than their neighbors due to the landscaping**. The related statistical test was also “significant” based on a .05 p-value. (As a cool side note for the nerdy data people—this test was done on the interaction between before and after and participant and control, which is a difference in differences test).

Though this analysis can’t tell us how much water the average Utahn would save, it does tell us that volunteers save about 1,215 gallons a month due to their more efficient landscape, so leaving the program open for others may still be worth it (depending on how much it cost to help landscape the participants’ lawns, something beyond my expertise, but something city stakeholders would know). Though, there is one more important step to be sure of this, that I talk about in the conclusion.
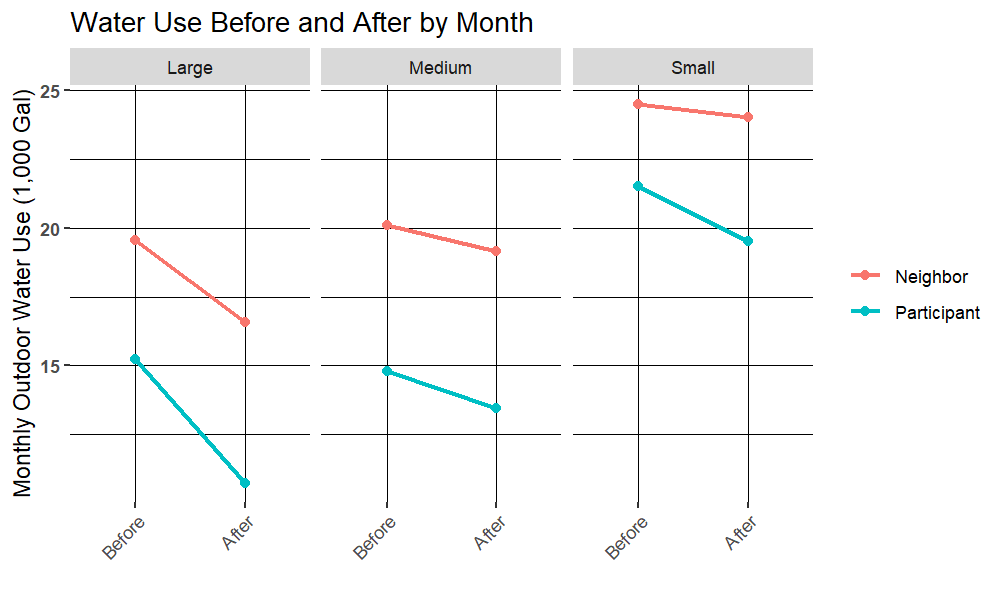
A final interesting visual for this project was how water was saved based on the size of the project (or the three-way interaction between before/after, participant/control, and size of project). This was not a statistically “significant” interaction, but it’s still interesting. For example, note how the small projects tended to save more water.

[]
My personal speculation as to why we see the small projects saving more water is because of how “small” was defined by the scientists. The size category made for each project was based on the proportion of the total property that was landscaped. This could mean a “small” project for a large property landscaped more land than a “large” project on a small property. Perhaps the larger properties (likely with families more likely to afford landscaping) were more common among the small projects, or all the projects together. If so, these projects probably saved more water. Smaller homes may have had the means to do a “large” project because, overall, it wasn’t all too expensive to do all their property. The medium projects could have been smaller projects on medium houses, or small houses, ultimately being the smallest projects.
But again, this is just a guess, maybe worth more investigating, maybe not. According to my statistical test, it’s likely to have been random.
Conclusion
In the end, it seems that landscaping projects whose funding was assisted by cities are able to help people in their efforts to save water, and may be a helpful way to encourage certain people to landscape when they otherwise couldn’t or wouldn’t. The next steps needed to better understand if the policy is truly effective, and how to improve the efforts to make more sweeping statements on how to save water would be: first, survey participants and ask if they would have landscaped if it weren’t for the financial help, and second, try to figure out a way to randomize participants.
The first step would be the last peice to being confident this policy is effective, because if these participants were going to landscape whether or not they got help, then the water would have been saved without the need of the tax dollars, and they could then use that money in other water-saving efforts. This step would be as simple as following up, or tracking new data that includes a survey asking if participants would landscape or not if it weren’t for the help.
The second step to maximize the impact of this policy would be to select a large, random group of people, and assign some to get their properties landscaped (perhaps incentivizing through full subsidies) and asking random neighbors to NOT landscape for the time of the study as controls, and do the same analysis. This could then be used to be able to say-if we want to save X gallons of water, we need to help Y amount of people landscape, which would likely cost about $Z.{[]}